Packaging EPR fees on one map
Of the 27 countries in this library, 9 publish a PET bottle rate you can compare in euros per tonne; 7 publish a packaging tariff with no separate PET bottle line, and 6 publish no tariff at all (2026).
PET bottles — 2026
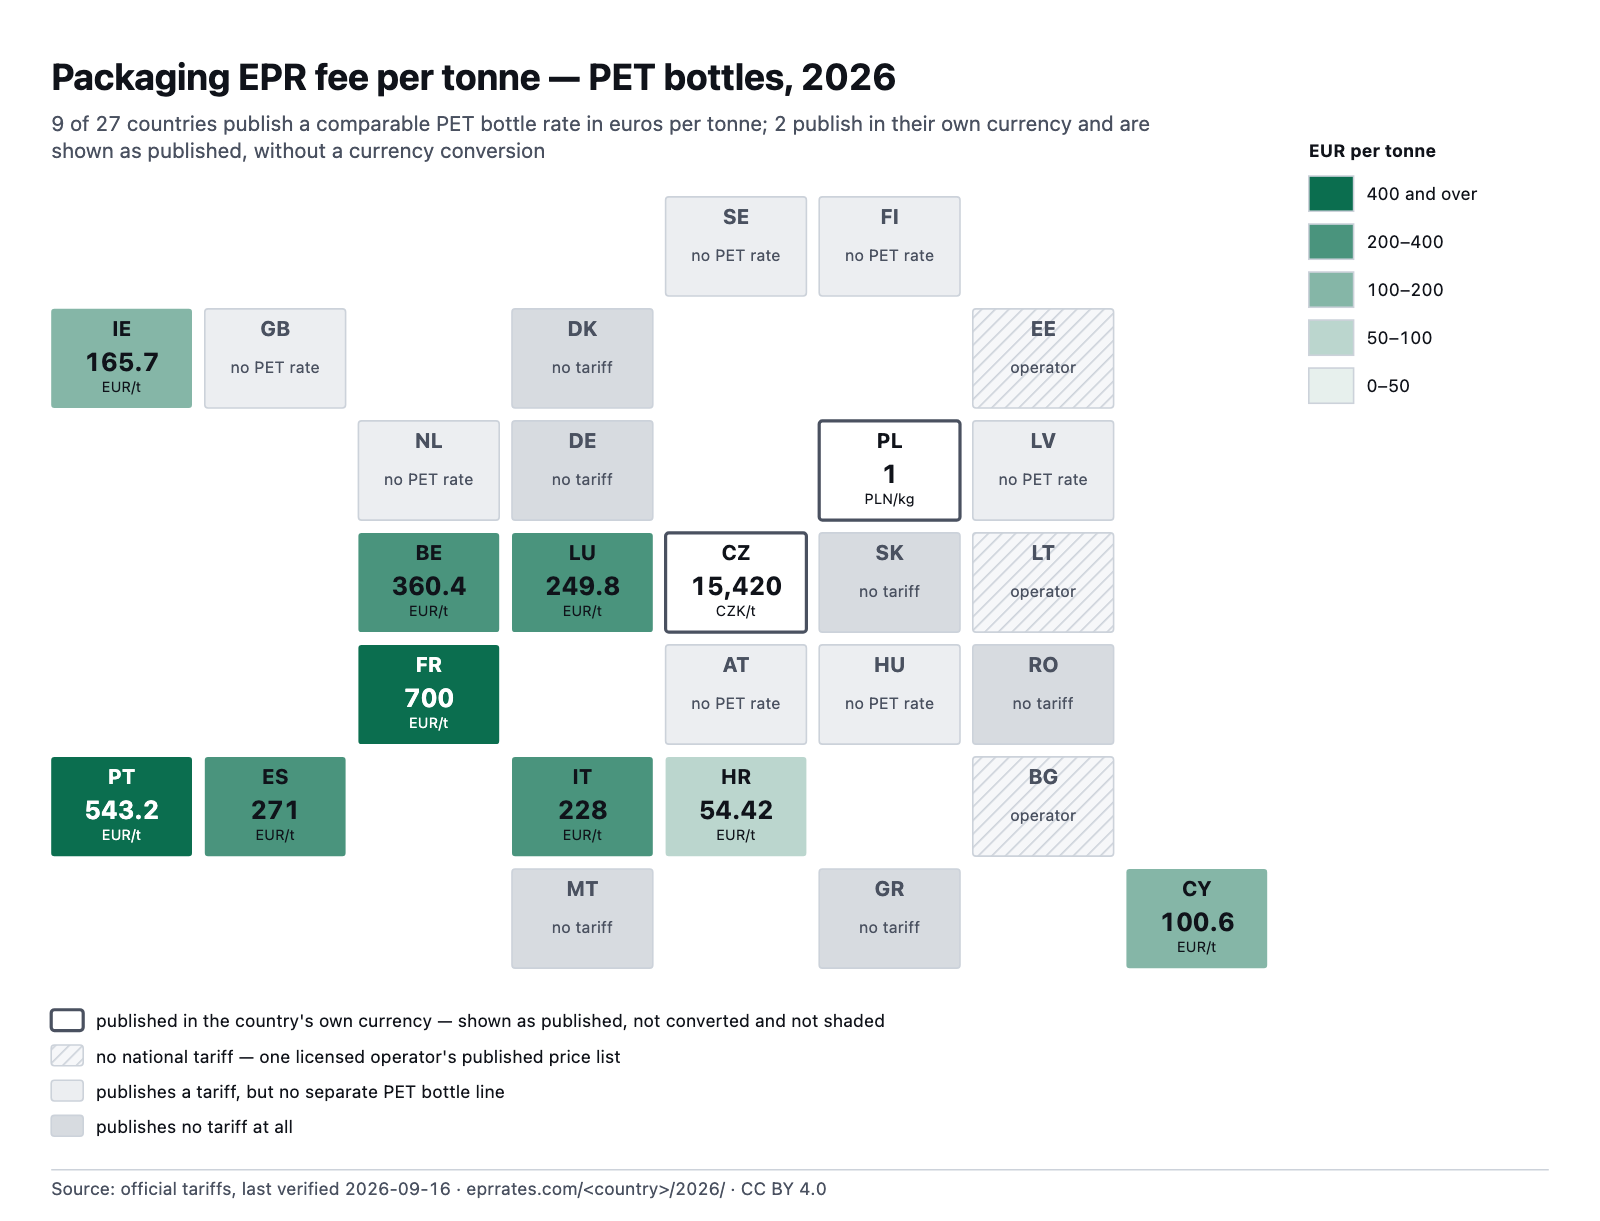
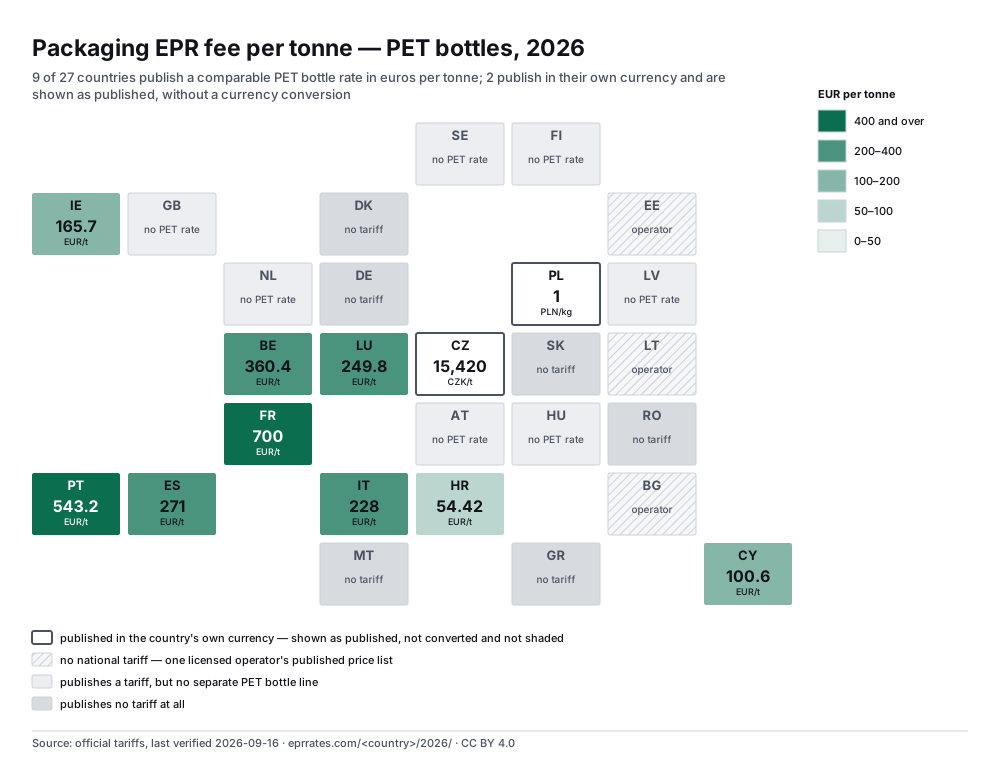
9 of 27 countries publish a comparable PET bottle rate in euros per tonne; 2 publish in their own currency and are shown as published, without a currency conversion. Shaded by euros per tonne, in the bands shown on the right of the map; each tile also carries the figure itself, so the colour is never the only signal. PNG · SVG
Embed or cite this map
<img src="https://eprrates.com/maps/epr-fee-map-pet-bottles-2026.png" alt="Packaging EPR fee per tonne — PET bottles, 2026. 9 of 27 countries shown with a comparable figure in euros per tonne." width="1000" height="763">
<p>Packaging EPR fee per tonne — PET bottles, 2026 — <a href="https://eprrates.com/maps/">EPR Rates</a>, CC BY 4.0</p>
EPR Rates (2026). Packaging EPR fee per tonne — PET bottles, 2026. https://eprrates.com/maps/ · Retrieved 2026-09-17. CC BY 4.0.
Paper and cardboard — 2026
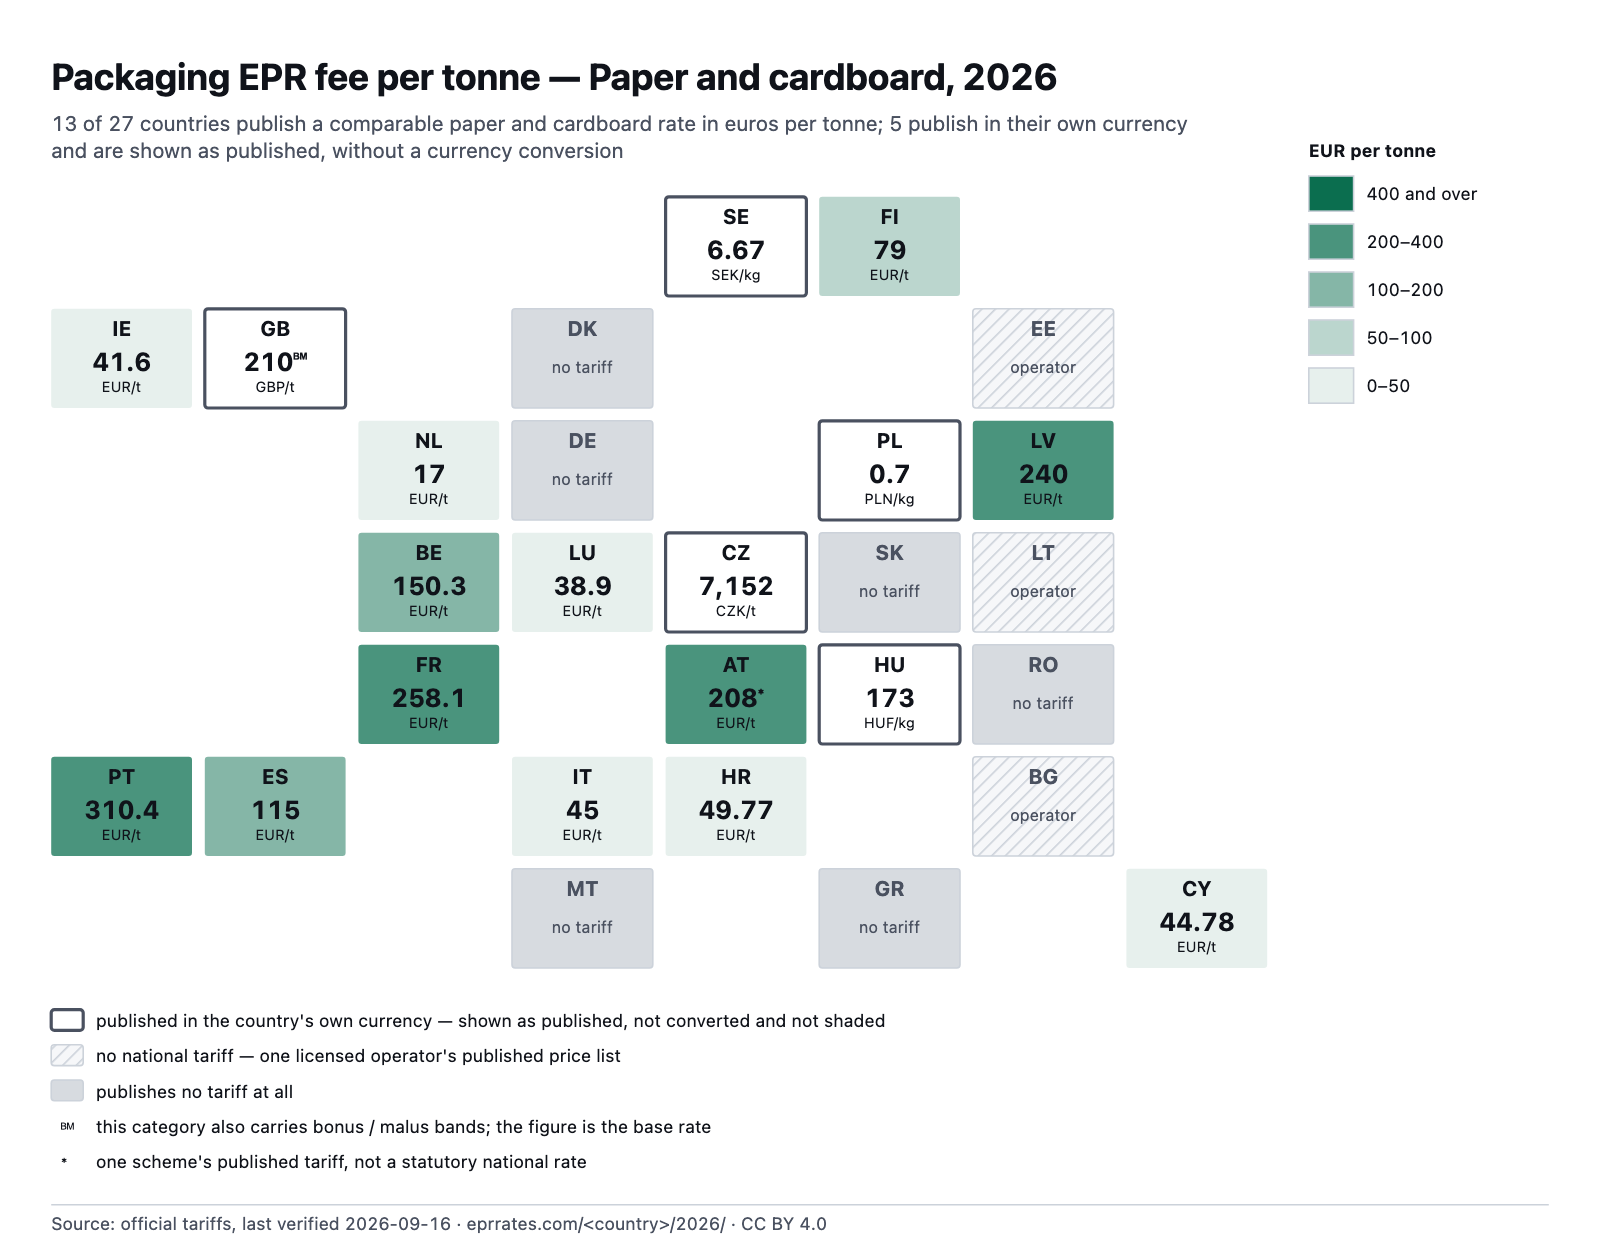
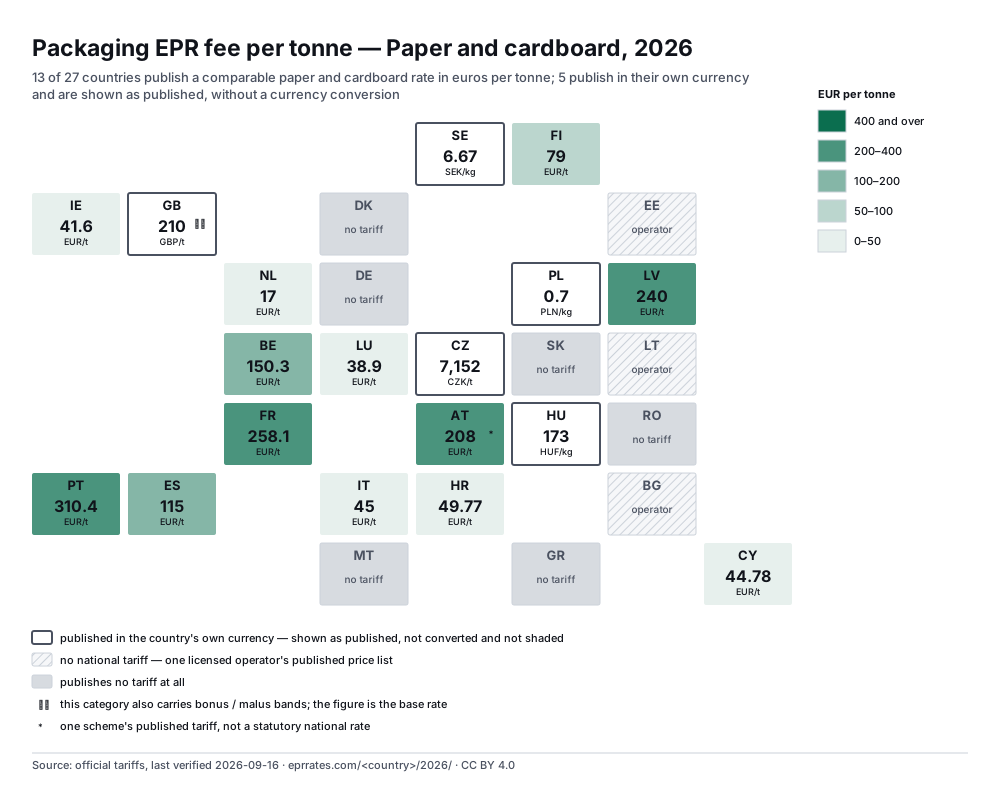
13 of 27 countries publish a comparable paper and cardboard rate in euros per tonne; 5 publish in their own currency and are shown as published, without a currency conversion. Shaded by euros per tonne, in the bands shown on the right of the map; each tile also carries the figure itself, so the colour is never the only signal. PNG · SVG
Embed or cite this map
<img src="https://eprrates.com/maps/epr-fee-map-paper-cardboard-2026.png" alt="Packaging EPR fee per tonne — Paper and cardboard, 2026. 13 of 27 countries shown with a comparable figure in euros per tonne." width="1000" height="785">
<p>Packaging EPR fee per tonne — Paper and cardboard, 2026 — <a href="https://eprrates.com/maps/">EPR Rates</a>, CC BY 4.0</p>
EPR Rates (2026). Packaging EPR fee per tonne — Paper and cardboard, 2026. https://eprrates.com/maps/ · Retrieved 2026-09-17. CC BY 4.0.
Glass — 2026
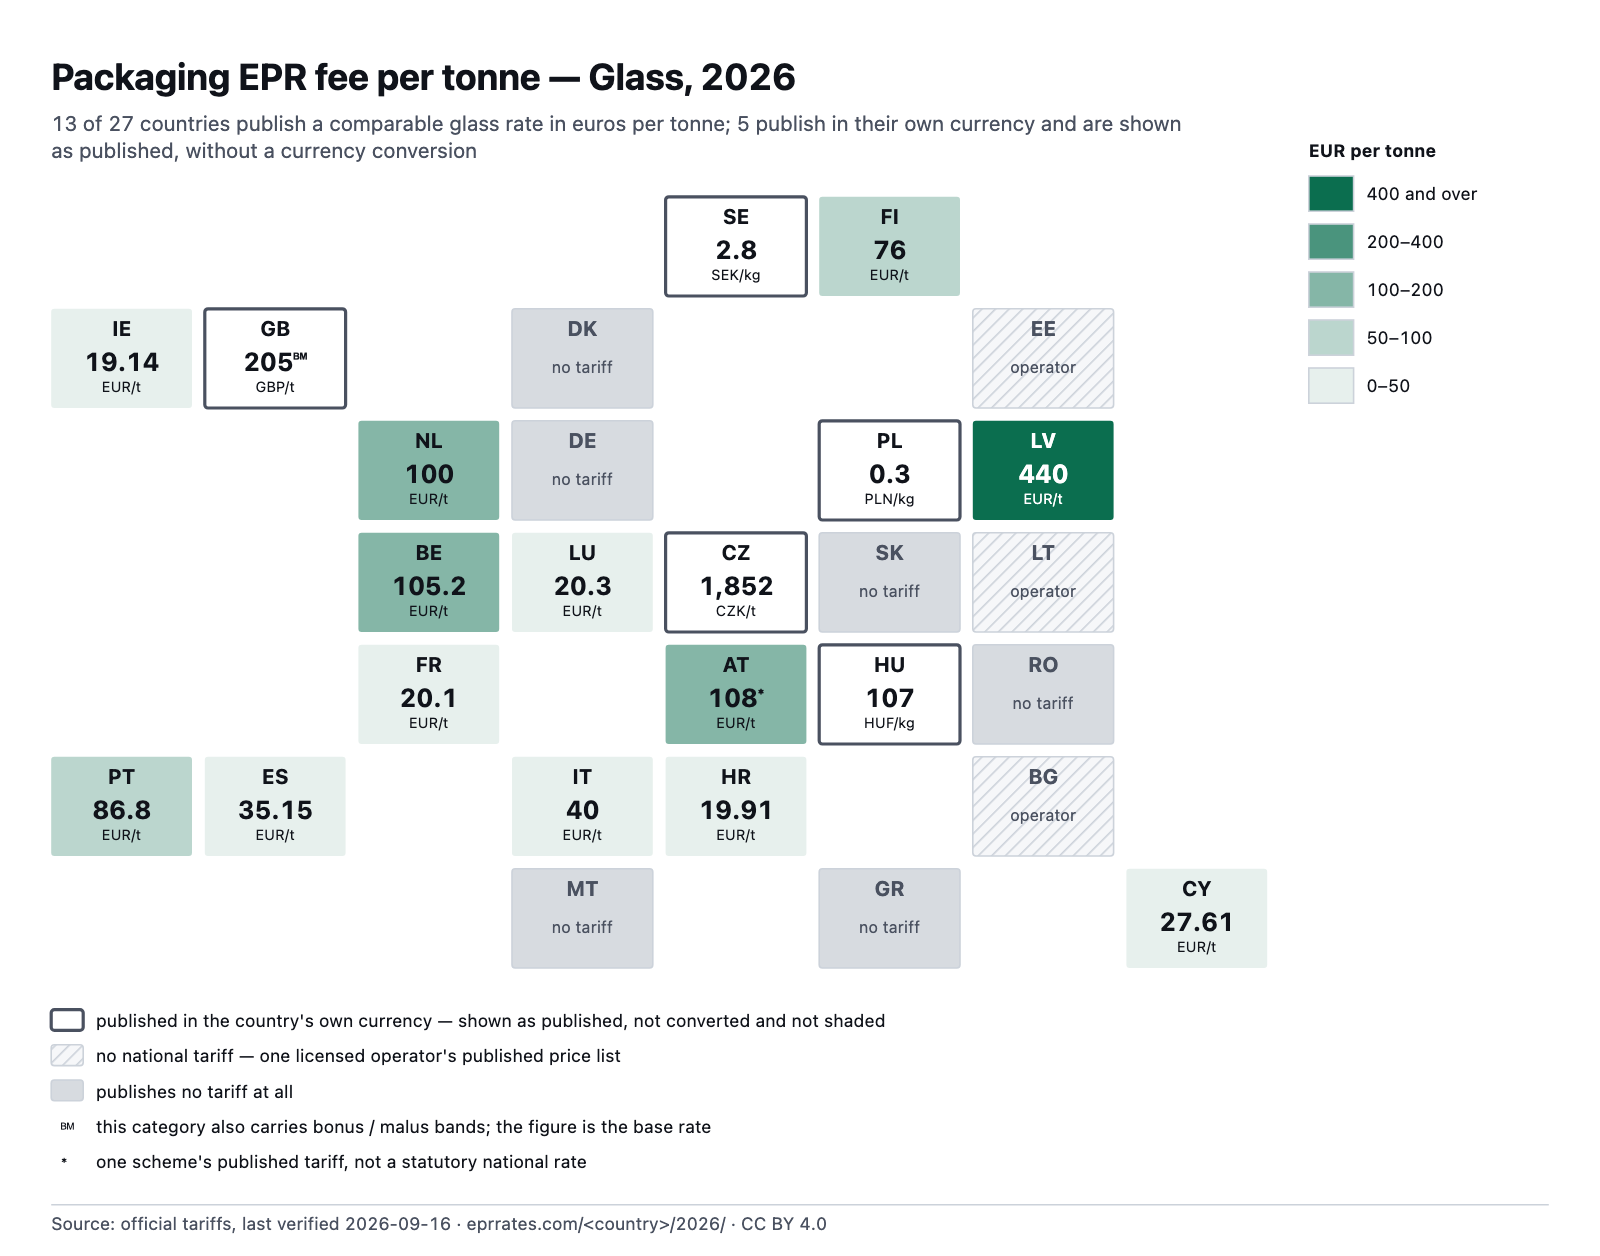
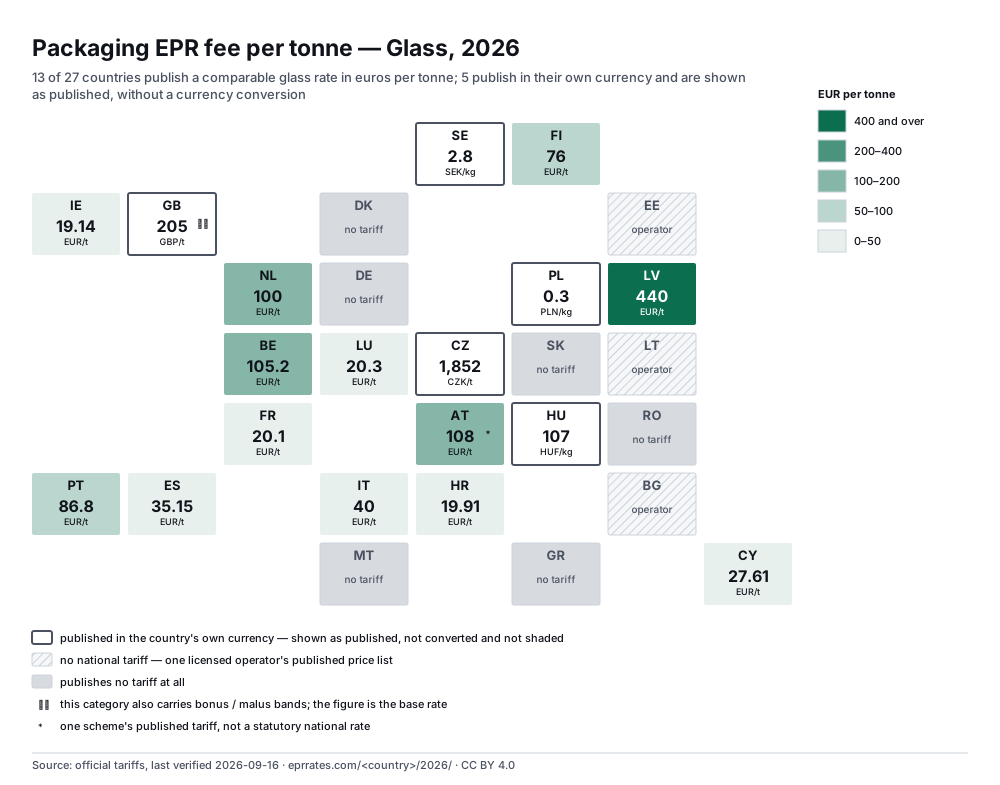
13 of 27 countries publish a comparable glass rate in euros per tonne; 5 publish in their own currency and are shown as published, without a currency conversion. Shaded by euros per tonne, in the bands shown on the right of the map; each tile also carries the figure itself, so the colour is never the only signal. PNG · SVG
Embed or cite this map
<img src="https://eprrates.com/maps/epr-fee-map-glass-2026.png" alt="Packaging EPR fee per tonne — Glass, 2026. 13 of 27 countries shown with a comparable figure in euros per tonne." width="1000" height="785">
<p>Packaging EPR fee per tonne — Glass, 2026 — <a href="https://eprrates.com/maps/">EPR Rates</a>, CC BY 4.0</p>
EPR Rates (2026). Packaging EPR fee per tonne — Glass, 2026. https://eprrates.com/maps/ · Retrieved 2026-09-17. CC BY 4.0.
How to read them
- What the figure is. One material category per map, one representative row per country — the same row the cross-country comparison table uses, linked there to the official tariff it came from. The figure is the base rate for 2026 in euros per tonne. Nothing is averaged, nothing is combined into a basket, and no currency is converted: the countries that publish in their own currency are shown as published and left off the colour scale.
- What an empty tile means. Three different things, and the maps keep them apart. No tariff = the country publishes none at all, so there is no figure to show. Operator = there is no national tariff and the figure available is one licensed operator's published price list, which is not a statutory rate. No … rate = the country does publish a tariff, but not a separate line for that material. Saying "no tariff" about a country in the third group would be wrong, so we do not.
- What you may do with them. The maps are published under CC BY 4.0: reuse them anywhere, including commercially, if you credit EPR Rates and link back to this page. The embed block under each map already carries that credit. The official tariff documents the figures were read from remain under their publishers' terms.
Reuse and attribution
Copy the block under any map and the attribution comes with it. If you would rather write it yourself, the wording is: Source: EPR Rates, https://eprrates.com/maps/, CC BY 4.0. The image URLs are permanent — they will not move when the rates change, and the files are rebuilt from the library on every update, so an embedded map stays current.
Every figure on these maps is one click from the rate row it came from: open the comparison table and the cell links straight to the official source and the date we last read it.
How to cite
EPR Rates (2026). Packaging EPR fees on one map, 2026. https://eprrates.com/maps/ · Retrieved 2026-09-17. CC BY 4.0.
@misc{eprratesmaps,
  title = {Packaging EPR fees on one map, 2026},
  author = {{EPR Rates}},
  year = {2026},
  url = {https://eprrates.com/maps/},
  note = {Retrieved 2026-09-17. CC BY 4.0}
}
Rate figures are extracted from the official publications listed under Sources; those source documents remain under their publishers' terms.